

Part of classic technical analysis patterns, wedges show reversal conditions. From the moment the price breaks from it, volatility usually increases.
However, not all wedges show reversal conditions. Sometimes, they’re powerful continuation patterns. However, this happens rarely and therefore it could easily be downplayed with a sound money management system.
This article aims to lay down the rules of a wedge and how to trade it. But also, to show why it is important to have a stop loss in place when trading such patterns.
As for the money management system, wedges allow for big risk-reward ratios. Sometimes, in strong reversals, traders trail the stop and the outcome is amazing.
Before going into more details, we should mention that there are two types of wedges:
- Rising wedge. A rising wedge is falling. Hence, it is a bearish pattern. After the break, traders go short.
- Falling wedge. A bullish pattern, a falling wedge rises. Traders go long after its break.
It is generally believed that a rising wedge appears at the end of a bullish trend. Therefore, it shows bearish conditions.
Consequently, a falling wedge appears at the end of a bearish trend. Hence, it shows a possible bullish reversal.
Yet, that’s not true all the time. Sometimes a wedge appears as the leg of a triangle. Contracting triangles often end up in having a wedge forming as the last leg.
Trading Wedges – Generalities
Just like in triangles, the aspect of a wedge is given by two trend lines. However, there’s a catch.
Triangles with the Elliott Waves Theory have letters that mark the end of each leg. A triangle has five legs, so the a-b-c-d-e is the proper labeling.
When it comes to wedges, they have still five segments. But, even the Elliott Waves Theory uses numbers, not letters for it.
More on this a bit later. For now, here’s how a rising wedge looks like.

This one formed on the daily EURUSD chart. For two years, the price was in a bullish trend.
However, while rising, the price action showed bearish conditions. The shape of a wedge appeared on the chart.
As we mentioned earlier, a wedge has two trend lines. Because the legs of it are numbered with numbers, the two trend lines are called the 2-4 and the 1-3 trend lines.
By far, the 2-4 trend line is the most important one. It shows the end of the wedge.
When the price breaks it, a powerful trend starts. The fact that the price rose, while contracting in a shape of a wedge is a sign of counter-trend strength.
If you want, the 2-4 trend line acts similarly with the b-d trend line of a triangle. When the price breaks them, the wedge, respectively the triangle’s consolidation ends.
Here are some general rules to follow when dealing with a rising or a falling wedge:
- Look for price to pierce the 1-3 trend line.
- The 2-4 trend line usually gets retested after the break. However, that’s not mandatory.
- When labeling the wedge, look for prices to overlap. Namely, look for the 4th leg to go into the second leg’s territory. Most of the times it will end into that territory.
These are the minimum requirements for a wedge. The Elliott Waves Theory has some more rules for it. A so-called ending diagonal is treated differently with the Elliott Waves Theory.
Steps to Trade a Wedge
To put into perspective the power of a wedge, let’s see what happened after the one presented above broke lower. While not all wedges end up having such a break, the move is representative of most of them.
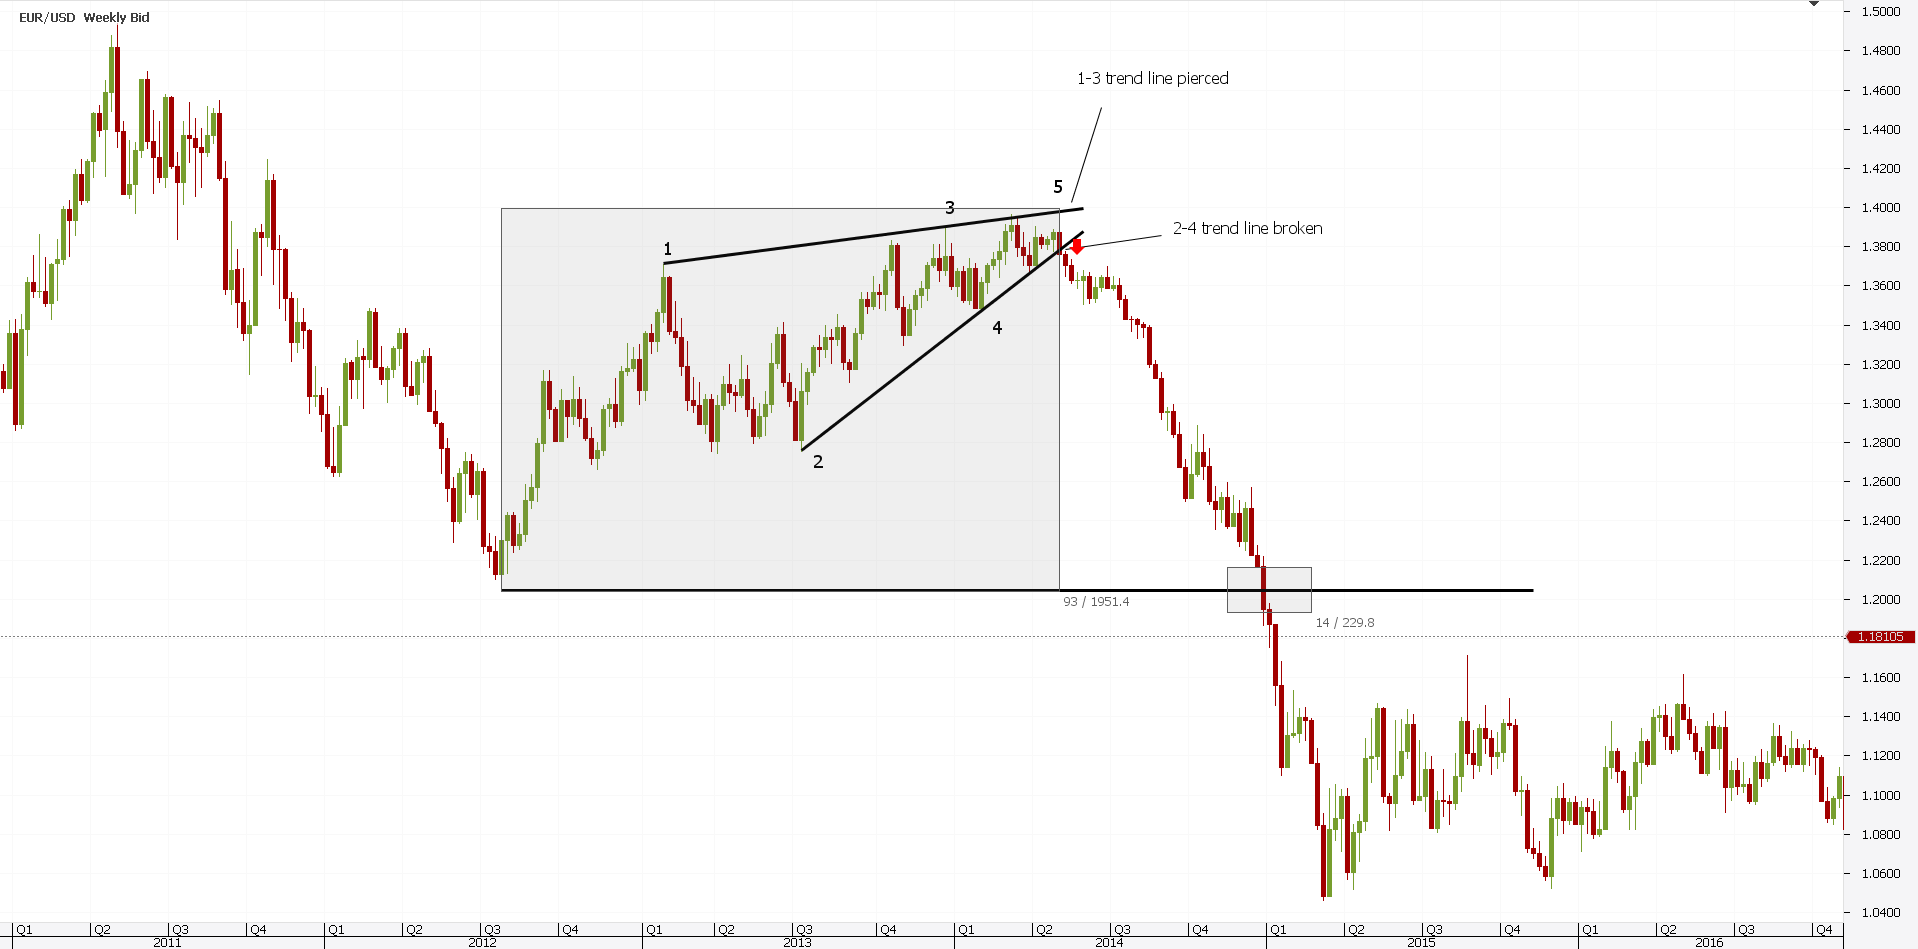
The price virtually melted from the moment the 2-4 trend line broke. Now, let’s check the rules mentioned above:
- The 1-3 trend line is clearly pierced by the 5th
- Overlapping between the 2nd and the 4th legs exists. The 4th leg ends into the 2nd wave’s territory.
- The price breaks the most important trend line: the 2-4. That’s a powerful signal, and traders look to go short.
It took the EURUSD two years to break the pattern. From the moment it did, no one can say that the market took them by surprise.
After all, this is the daily time frame. Even after the price broke the b-d trend line, a one-week or so consolidation form. As such, it was plenty of time to jump on the short side.
What’s interesting here is that the b-d trend line wasn’t retested. This happens most of the times. Yet, it wasn’t the case here.
To trade such a pattern, traders must follow several steps. First, they need to wait for the 2-4 trend line to break. Until that happens, all plans should be aborted.
After the break, using the example above, they go short. But, always a stop loss must be in place.
The logical place to put the stop is right at the top of the pattern. That is the highest point in the rising wedge pattern.
Next, traders set a realistic risk-reward ratio. While in the Forex market this is 1:2 or 1:2.5, in the case of a wedge, the minimum distance the price must cover is fifty percent of the whole distance the wedge traveled.
Finally, aggressive traders use trailing stops orders to ride the resulting trend as much as possible. As such, the risk-reward ratio becomes much bigger than initially targeted.
Conclusion
To sum up, rising and falling wedges are great patterns for contrarian traders. While the price is bullish (in a rising wedge) or bearish (in a falling one), by the moment the wedge breaks, the price rarely looks back.
With one exception, though. That’s called a running variation of a contracting triangle.
This type of triangle looks like a wedge, it breaks the 2-4 trend line…only to retrace aggressively. It represents the solid proof that trading wedges without a stop loss is not a wise strategy. Price may reverse and trip the highest/lowest point in a blink of an eye.