
The volatility of the forex world is one of those factors that attract a huge number of beginner and professional traders.
Since volatility creates opportunities for profits, obviously every trader appreciates those investment assets on which a greater price movement is present. There is also the possibility to go indifferently long and short and apply more or less consistent leverage, so this explains the reason for the great success of the forex market among traders.
After opening a Forex account and starting a daily trading, traders must clearly try to develop their own graphic software in order to have a constant feedback about the volatility of the traded currencies. Each cross makes history to itself (for example, EurChf has a completely different volatility from UsdMxn) and therefore each chart must be set according to the underlying asset. Among the many useful tools to measure the volatility, we can find the so called ATR, one of the most immediate and interesting ones.
Forex volatility measurement with the Average True Range (ATR)
The Average True Range (ATR) is a statistical indicator used to measure the market volatility created by Welles Wilder. In general, the ATR is a volatility meter and is the result of the moving average of the price amplitude of a given period.
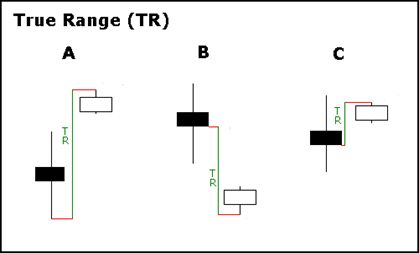
The True Range is defined as the difference between:
- The top and low of today,
- The top of today and the closure of yesterday
- The low of today and the closure of yesterday
The ATR is a good measure of the investor sentiment and by convention it is said that:
- high and rising levels of the ATR represent the continuation of the strength of the trend
- low or descending levels represent a decrease in intensity and indicate the start of a stabilization phase before a possible breakout.
An example can be useful to try to understand this theory better.
From this point of view, what happened to EurUsd in the chart below is exemplary. The 14-day ATR, from September to December 2017, began to fall until it reached a low at the end of the year, exactly when EurUsd was going to force the trend line that had been holding the exchange rate for a few weeks. This trend was the clear sign that the bull market was about to recover from a prolonged accumulation phase. Attending to resistance breaking movements with a progressively increasing ATR is a health signal of the current trend.
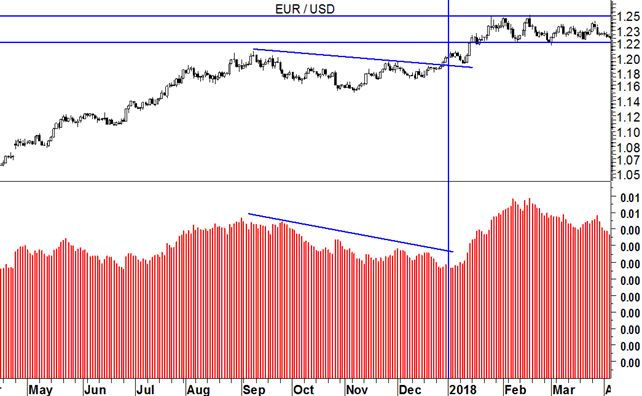
The trader, in addition to the classic oscillators such as RSI, MACD, etc … must daily monitor the trend of indicators of the ATR to understand if a spike of volatility can be exploited in their favour. Having tools that can confirm or not a movement like the one seen above is also essential for the size of the operation. A corrective movement like that of EurUsd accompanied by the contraction of volatility is a good signal when the resistance is violated as effectively happened in this case. We are facing a classic accumulation phase that comes to an end when the market reaches great levels of tranquillity. And the surprise causes volatility and lots of potential earnings pips.