
The euro dollar chart suggests a continuation of the recent uptrend. Let’s break it down.
1. Trend & Price Action
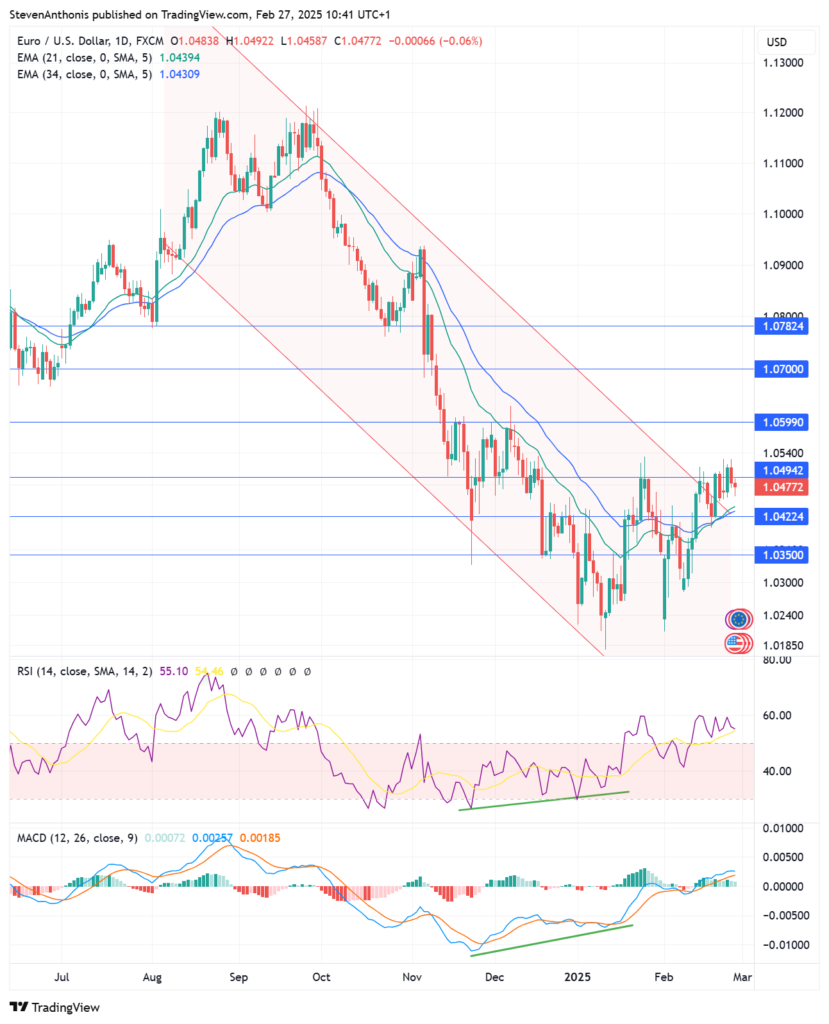
- The downward channel has been broken, indicating a shift in momentum.
- The price is above both the 21 EMA and 34 EMA, confirming a short-term bullish bias.
- Resistance is seen around 1.0494 – 1.0599, while support is at 1.0422 and 1.0350.
2. RSI Analysis (Relative Strength Index)
- Bullish divergence detected: RSI made higher lows while price made lower lows (December). This signaled weakening bearish momentum.
- Currently, RSI is at 55, above the neutral 50 level, indicating bullish strength.
3. MACD Analysis (Moving Average Convergence Divergence)
- Bullish divergence confirmed: The MACD line formed higher lows while price formed lower lows in December.
- MACD line is above the signal line, with green histogram bars increasing, confirming bullish momentum.
4. Key Levels & Trade Setups
✅ Bullish Trade Setup (Breakout Play)
- Entry: Buy on a break and close above 1.0494 (previous resistance).
- Target 1: 1.0599
- Target 2: 1.0700
- Stop-loss: Below 1.0422
Confirmation: Look for RSI staying above 50 and MACD histogram continuing to rise.
✅ Bullish Trade Setup (Pullback Entry)
- Entry: Buy at 1.0422 (previous resistance turned support) if price pulls back.
- Target 1: 1.0494
- Target 2: 1.0599
- Stop-loss: Below 1.0350
Confirmation: Look for RSI to stay above 50 and a MACD crossover holding strong.
Bearish Trade Setup (Rejection Scenario)
- Entry: Sell if price fails to break 1.0494 and shows strong rejection.
- Target 1: 1.0422
- Target 2: 1.0350
- Stop-loss: Above 1.0500
Confirmation: Look for RSI to drop below 50 and MACD histogram to turn red.
Conclusion & Bias
- The bullish divergence + broken downward channel suggest a higher probability of an uptrend.
- Best trade opportunity: Buy breakout above 1.0494 or pullback to 1.0422.
- If 1.0494 fails, be cautious as a retracement to 1.0422 or 1.0350 could happen.
Bullish bias, but confirmation needed above resistance!