
Solana (SOL) has been a strong performer in the last bull cycle, but recent price action shows serious weakness. After falling more than 50% since mid January, SOL is now testing a key support zone.
The question is: Is this a buying opportunity, or will the selloff continue?
Let’s break down the technical outlook and specific trade setups.
1. Trend & Price Action
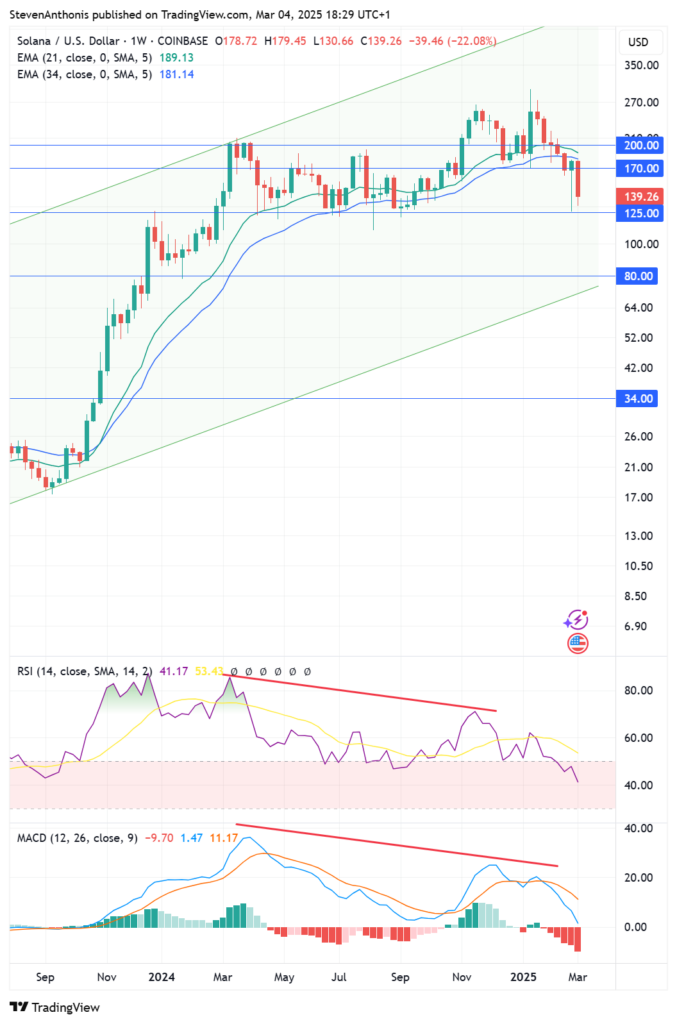
✅ Bullish Long-Term Trend: SOL remains in an uptrend within a well-defined ascending channel.
❌ Recent Breakdown: The price lost the 21 EMA (188.99) and 34 EMA (181.05), signaling bearish momentum.
❌ Bearish RSI & MACD Divergence: Clear lower highs in RSI & MACD, despite price making higher highs. This was a warning sign before the drop.
✅ Key Support Test: SOL is now testing 125 as support.
2. RSI Analysis (Relative Strength Index)
- Current RSI: 40.94 → Bearish momentum increasing.
- Bearish Divergence Played Out: Lower highs on RSI while price made higher highs.
- Oversold Level Not Yet Reached: If RSI drops below 35, we might see capitulation before a bounce.
3. MACD Analysis (Moving Average Convergence Divergence)
- Bearish Crossover Confirmed: MACD line crossed below the signal line, showing strong downward momentum.
- Negative Histogram Expanding: Red bars increasing → momentum favors bears.
- Bullish reversal signal would require a slowdown in selling pressure (MACD histogram turning lighter red).
4. Key Support & Resistance Levels
✅ Resistance Levels (If SOL Bounces):
- 170-188 (EMAs & previous support) → Now strong resistance
- 200 → Previous tops and psychological resistance
Support Levels (If SOL drops further):
- 125 (Current Key Support)
- 80 (Next Major Support from Previous Consolidation)
- 34 (Strong Historical Support Zone, worst-case scenario)
5. Trade Setups
✅ Bullish Trade Setup (Bounce Play)
- Entry: Buy if SOL holds 125-137 and shows a reversal (e.g., bullish engulfing candle).
- Target 1: 170 (previous support, now resistance).
- Target 2: 200 (psychological level).
- Stop-loss: Below 120.
Confirmation: RSI holding above 40 and MACD slowing its decline.
✅ Bullish Trade Setup (Deep Dip Buy)
- Entry: Buy at 80 if SOL breaks down further (historical support).
- Target 1: 125 (previous key support).
- Target 2: 170.
- Stop-loss: Below 70.
Confirmation: Extreme RSI oversold (below 30) and bullish divergence forming.
Bearish Trade Setup (Short Opportunity)
- Entry: Short if SOL rejects 170 and fails to reclaim it.
- Target 1: 137.
- Target 2: 80 (if momentum increases).
- Stop-loss: Above 175.
Confirmation: MACD still negative & RSI unable to reclaim 50.
6. Conclusion & Bias
- Short-term bearish, but long-term trend remains bullish if SOL holds the 125 support zone.
- If the 125 level fails, a drop to 80-90 is likely before buyers step in.
- If SOL reclaims 170+, bulls regain control and new highs could come later in 2025.
Best trade: Buy a confirmed bounce at 125 or deep dip at 80 for a safer long-term play!