
Bitcoin has been under pressure for weeks now, but signals on both the daily and weekly charts suggest the correction might be losing steam — or at least, nearing a pivotal moment.
Here’s a breakdown of what the charts are telling us right now, with clear bullish and bearish scenarios for the days and weeks ahead.
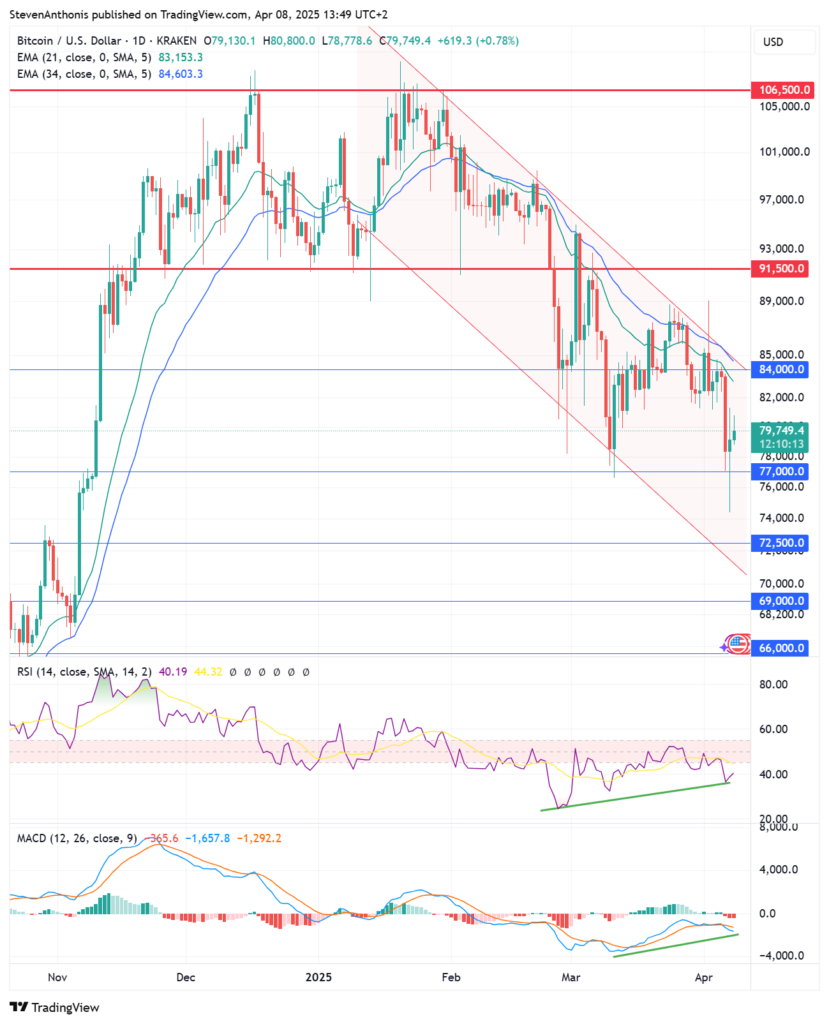
Daily Chart Analysis
Key Observations:
-
Downtrend resistance around $84,000 is still intact, reinforced by both the 21 and 34 EMAs, which continue to slope downward.
-
Price recently broke below the prior low at $77,000, triggering concern among bulls — but quickly recovered, hinting at a potential bear trap.
-
Momentum indicators are showing bullish divergence:
-
RSI made a higher low while price made a lower low — a classic sign of weakening bearish momentum.
-
MACD also shows divergence.
-
Takeaway: The recovery after the breakdown and positive divergence in momentum suggest the downward pressure may be waning. However, the trend is not yet bullish — price remains below both EMAs and the red descending channel.
Weekly Chart Analysis

Key Observations:
-
Bitcoin is testing a previous top near $74,000, which is now acting as potential support. This aligns with the lower boundary of the green rising channel that has guided the bull trend since late 2022.
-
The 21 and 34 weekly EMAs are above the current price — a warning sign — but have not yet made a bearish crossover (dead cross).
-
If we look at history, each time price dipped below these EMAs (green ovals), it eventually bounced back strongly and reclaimed the trend.
-
The RSI found support where it did previously (green arrows), reinforcing the idea of cyclical rhythm in Bitcoin’s price action.
-
MACD is nearing the centerline, which has marked turning points in the past.
Takeaway: The weekly structure still fits within a bullish framework unless the price decisively breaks below the rising channel and $74,000 support.
Scenarios Going Forward
Bullish Scenario
-
Price holds $74,000 support, confirming it as a successful retest of the prior breakout level.
-
A break above $85,000 and the red downtrend line on the daily chart would invalidate the current corrective structure.
-
RSI and MACD momentum support the bullish reversal, especially if the MACD flips positive on both timeframes.
-
Target would be a retest of $91,500, then potentially the all-time high zone around $106,500.
Bearish Scenario
-
The $74,000 level fails to hold, and price breaks below the rising green channel on the weekly chart.
-
The EMAs complete a bearish crossover (dead cross) on the weekly chart.
-
Momentum fails to recover and MACD accelerates further downward.
-
Next support levels lie at $68,000, $61,000, and $54,000 — all horizontal levels from past consolidations.
Final Thoughts
Bitcoin is in a textbook technical inflection zone:
-
The weekly trend is still technically intact, but fragile.
-
The daily chart is showing the first signs of bullish divergence, suggesting a potential short-term bottom.
-
Until we break out of the descending channel and reclaim $85,000+, caution is still warranted.
-
But don’t ignore the reversal potential building under the surface.
The coming days could determine whether this correction is just another shakeout in a long-term bull market, or the start of something more serious.