
Gold (XAU/USD) has been on a strong uptrend, climbing steadily within its rising channel and recently hitting multi-year highs. However, technical indicators now flash warning signs, suggesting a potential slowdown.
Is this just a healthy pullback before another leg higher, or is a deeper correction coming?
Let’s analyze the key technical levels, momentum indicators, and potential trade setups.
1. Trend & Price Action
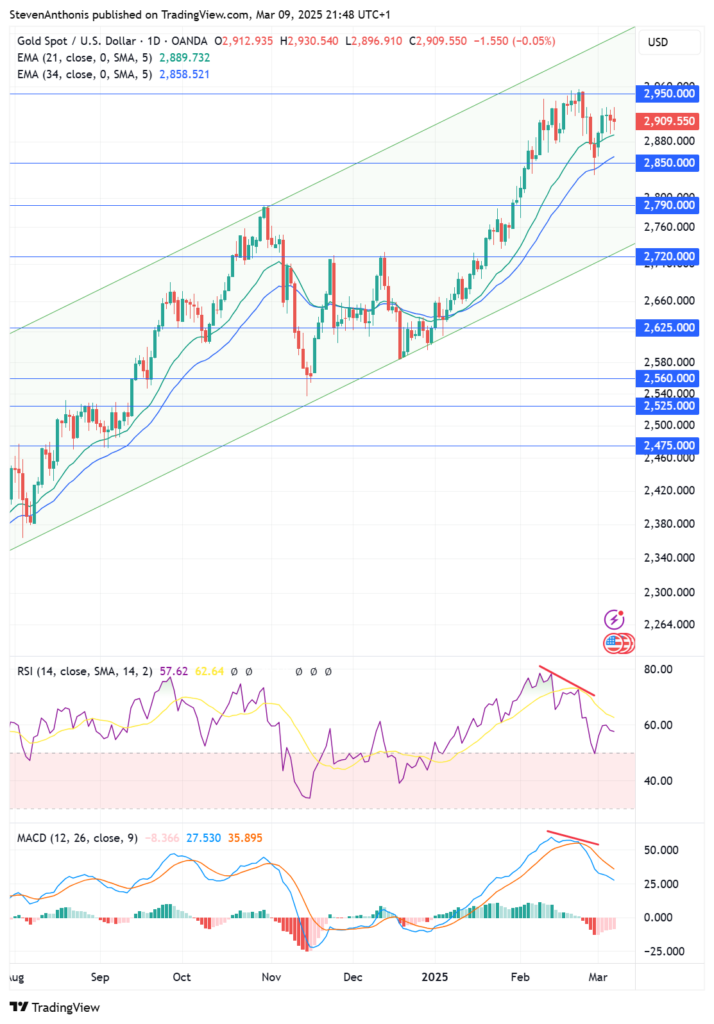
✅ Gold Remains in a Strong Uptrend: The price is still inside its rising channel, maintaining bullish momentum.
❌ Bearish Divergences Are Emerging: RSI and MACD made lower highs while price made higher highs—a sign of weakening momentum.
✅ Support Holds for Now: The recent dip found buyers around 2,850, which aligns with the 34 EMA (2,858), a critical support level.
❌ Lower High Forming? If gold fails to break 2,930+, a double-top pattern could emerge, signaling a possible reversal.
2. RSI Analysis (Relative Strength Index)
- Current RSI: 57.62 → Momentum remains positive but has weakened from overbought conditions.
- Bearish Divergence: RSI peaked above 75, but the latest price high came with a lower RSI reading, hinting at slowing buying pressure.
- Key Signal: If RSI fails to reclaim 62+, bears may take control.
3. MACD Analysis (Moving Average Convergence Divergence)
- MACD Histogram is Declining: Momentum is shifting downward.
- Bearish Divergence Confirmed: Just like RSI, MACD formed a lower high, showing that upward momentum is fading.
- Potential Sell Signal: If the MACD crosses below zero, it could confirm a deeper correction.
4. Key Support & Resistance Levels
✅ Resistance Levels (If Gold Resumes Its Uptrend):
- 2,930 – 2,950 (Recent Highs)
- Psychological Level: 3,000 (Long-Term Target for Bulls)
Support Levels (If Gold Breaks Down):
- 2,850 (Key Support, 34 EMA)
- 2,790 (Previous top)
- 2,720 (Channel Bottom & Major Support Zone)
5. Trade Setups
✅ Bullish Trade Setup (Buy the Dip Play)
- Entry: If gold holds above the 21 EMA.
- Target 1: 2,950 (Recent High).
- Target 2: 3,000 (Psychological level).
- Stop-loss: Below 2,850.
Confirmation: RSI reclaiming 62+ and MACD showing renewed bullish momentum.
✅ Bearish Trade Setup (Short the Lower High)
- Entry: If gold rejects 2,930 – 2,950 and fails to break higher.
- Target 1: 2,850 (First Major Support).
- Target 2: 2,790 (Stronger Support Zone).
- Stop-loss: Above 2,955.
Confirmation: Bearish candlestick rejection at resistance and continued RSI weakness.
Bearish Breakdown Trade Setup (If Gold Loses 2,850)
- Entry: Short if gold closes below 2,850 with strong volume.
- Target 1: 2,790 (Next Major Support).
- Target 2: 2,720 (Channel Bottom).
- Stop-loss: Back above 2,860.
Confirmation: Strong red candle below support with MACD turning negative.
6. Conclusion & Bias
- Gold remains bullish, but momentum is fading—a short-term pullback is likely.
- 2,850 is the key battle zone: If it holds, expect a push to 2,930+. If it breaks, 2,790 and 2,720 are the next targets.
- Best trade: Buy dips at 2,850+ confirmation or short a rejection at 2,930 – 2,950.
Gold traders should watch for confirmation before making their next move!