
Bitcoin’s weekly chart has clearly shifted into bear market territory. Momentum indicators have rolled over, the long-standing rising trend channel has broken down, and moving averages have formed a bearish crossover. However, price is now approaching key support levels while sentiment has reached extreme fear. Is a relief rally brewing or is more downside ahead?
The Bigger Picture: The Bull Market Has Ended
From a structural standpoint, the strong uptrend that defined the previous cycle has decisively ended.
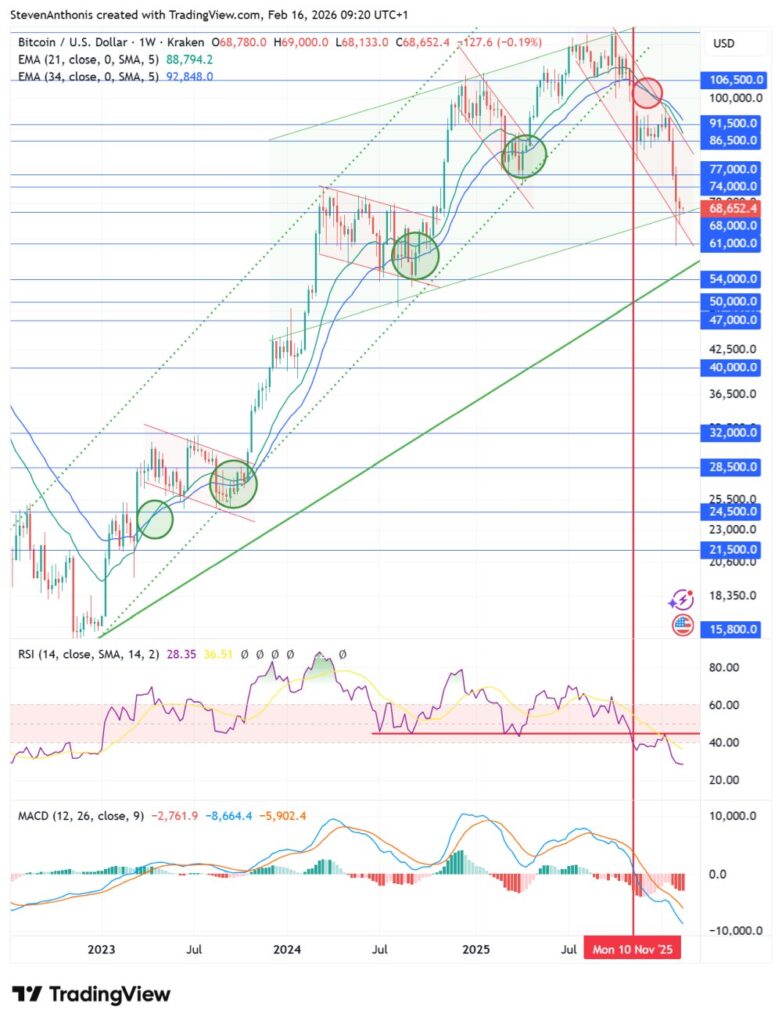
In November, Bitcoin broke below its dotted rising trend channel, a channel that had supported price action for most of the bull market. That breakdown marked a major technical shift. Rising channels represent controlled, healthy uptrends. When price exits such a formation to the downside on a weekly timeframe, it typically signals that the broader bullish phase has concluded.
Since then, the market has transitioned into a lower-high, lower-low structure consistent with a developing bear market.
The moving averages have confirmed this shift. The faster moving average has crossed below the slower one, forming a classic weekly dead cross. On higher timeframes, this crossover often signals sustained downside momentum rather than a short-term pullback.
Momentum Indicators: Bear Market Conditions
Momentum indicators reinforce the bearish picture.
MACD Below Zero
The MACD has moved below the zero line (as highlighted by the vertical red marker). This is significant because the zero line acts as the dividing line between bullish and bearish momentum on higher timeframes. When MACD trades below zero on the weekly chart, it reflects negative long-term momentum and often aligns with prolonged corrective phases.
Histogram bars remain negative, and the MACD lines are trending downward, suggesting that downside momentum has not yet fully reversed.
RSI Breakdown: A Critical Shift
The Relative Strength Index (RSI) is currently below 40, another classic bear market signal.
During the bull market, RSI repeatedly found support around the 45 level. Each dip into that zone acted as a launching pad for renewed upside. That 45 area functioned as a structural support level in momentum terms.
However, that support has now been decisively broken and what used to be support has turned into resistance. RSI attempted to reclaim the 45 level but failed, confirming the shift in market regime.
In bull markets, RSI typically oscillates between 40–90. In bear markets, it tends to range between 20–60. We now appear to be in the latter environment.
Price Structure: Dual Channel Dynamics
Although the steep bull channel has broken, price action suggests Bitcoin may now be trading within two overlapping structures:
-
A less steep green rising channel
-
A red descending channel
Currently, price is trading near the bottom of the green channel. At the same time, it is also close to the lower boundary of the red downtrend channel.
This creates an interesting technical inflection point. When price approaches confluence support areas like this, short-term bounces often occur, even in bear markets.
Key Resistance Levels
If a recovery develops, several resistance zones will need to be reclaimed to restore technical strength:
-
The descending red channel’s upper boundary
-
The weekly moving averages
-
The horizontal resistance zone between $86,500 and $91,500
That $86,500–$91,500 area stands out as a major supply zone. It previously acted as support during consolidation phases and now represents overhead resistance.
A move back above the moving averages and a weekly close above $91,500 would significantly improve the technical outlook and potentially signal that the bear phase is weakening.
Until then, rallies should be treated as corrective within a broader downtrend.
Sentiment: Extreme Fear
The Fear & Greed Index is currently at 12, which qualifies as extreme fear.
Historically, such readings often occur near local bottoms rather than tops. When sentiment becomes excessively pessimistic, markets can stage sharp relief rallies due to short covering and opportunistic buying.
However, extreme fear alone is not a reversal signal. In bear markets, fear can remain elevated for extended periods.
Still, the combination of:
-
Price near channel support
-
RSI approaching oversold conditions
-
MACD deeply negative
-
Extreme fear sentiment
creates the possibility of a technical bounce.
Bullish Scenario: Relief Rally Within a Bear Market
In the bullish case, Bitcoin holds the lower green channel and begins forming higher lows on shorter timeframes.
A recovery could first target:
-
The upper boundary of the red descending channel
-
The weekly moving averages
-
The $86,500–$91,500 resistance zone
Reclaiming the moving averages would be the first sign of strengthening structure. A decisive weekly close above $91,500 would invalidate the immediate bearish structure and suggest the market is attempting to transition back into a broader consolidation or even early re-accumulation phase.
For a true structural shift, momentum indicators would also need to confirm:
-
RSI back above 45
-
MACD crossing back above the zero line
Until those confirmations occur, any rally should be considered counter-trend.
Bearish Scenario: Downtrend Continues
If support fails and price breaks below the current channel structure, the next logical downside targets are:
-
$60,000
-
$54,000
These levels align with prior consolidation zones and historical support clusters.
A breakdown below $60,000 would likely accelerate selling pressure as longer-term holders reassess their positioning. A move toward $54,000 would represent a deeper correction consistent with previous Bitcoin bear cycles.
If momentum accelerates further and MACD expands negatively while RSI pushes toward 25 or below, the probability of extended downside increases.
Additional Observations
-
The steepness of the previous bull channel suggests the rally was extended and vulnerable to sharp correction.
-
The breakdown was decisive rather than gradual, often characteristic of cycle transitions.
-
The structure currently resembles early-stage bear market consolidation rather than a final capitulation phase.
Conclusion: Technically Bearish, But Oversold
The weekly chart clearly signals that Bitcoin is in a bear market:
-
MACD below zero
-
RSI below 40
-
Dead cross confirmed
-
Rising trend channel broken
However, price is approaching technical support while sentiment is extremely pessimistic.
This setup often produces short-term relief rallies, but not necessarily full reversals.
For bulls, the key level to watch is $91,500.
For bears, $60,000 and $54,000 are the next major downside targets.