

Bitcoin is showing strong technical signals that suggest the recent correction may be ending. While it’s too early to declare a new bull phase with certainty, both the daily and weekly charts show key momentum shifts, breakouts, and structural support that traders should pay close attention to.
Let’s break it down by timeframe and explore what to expect next.
Weekly Chart Overview
Key Observations:
-
Bitcoin remains within its long-term rising green channel, preserving the broader bullish structure.
-
However, it has been in a short-term downward red channel since the February top around $106,500.
-
The price has recently regained the 34-week EMA, an important early signal that momentum may be shifting. A breakout above the 21-week EMA (currently near ~$86,570) would confirm a trend reversal and possibly ignite a new leg higher.
-
Crucially, the 21 and 34 EMA have not made a bearish cross — suggesting the longer-term trend remains intact.
-
RSI has found support at a horizontal green level, which has historically marked bottoms (as seen in the previous green circles).
-
MACD looks like it might make a bottom above the zero line, signaling a potential bullish crossover and momentum shift.
Daily Chart Overview
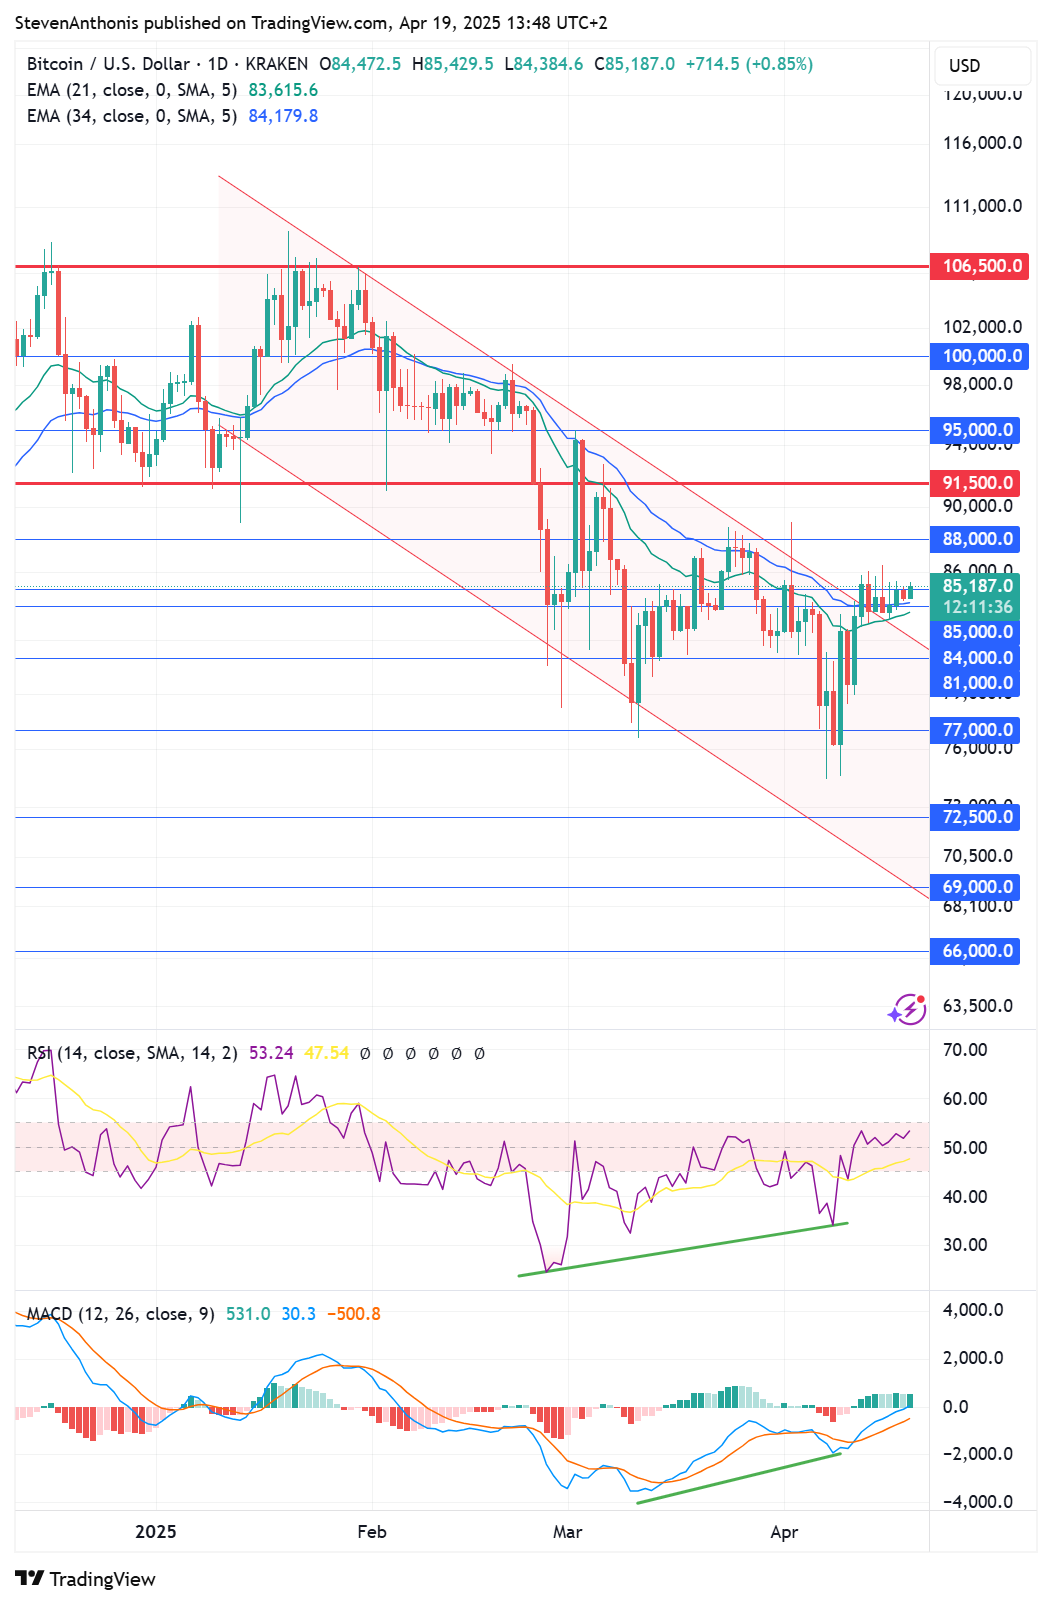
Key Observations:
-
Bitcoin has broken above the red downtrend line that guided the recent correction, a bullish signal suggesting the downtrend may be over.
-
Price is now back above the 21 and 34 daily EMAs, which are beginning to flatten, possibly preparing to turn up.
-
Both RSI and MACD showed positive divergence while the price made a lower low around ~$75,000. This divergence often precedes trend reversals, and the market seems to be responding accordingly.
-
MACD might go back above the centerline, which is bull market territory.
-
Bitcoin is now approaching the next resistance levels at $88,000 and $91,500, which could stall the rally in the short term.
Bullish Scenario
If the recent strength continues:
-
A decisive weekly close above the 21-week EMA (~$87K) would be a major technical milestone, opening the door for a move back toward the $91,500 resistance zone.
-
A breakout above $91,500 would likely trigger momentum buying and could lead to a retest of the all-time high zone near $106,500.
-
RSI and MACD support this scenario on the daily chart, as they are both hinting at growing bullish momentum.
Bearish Scenario
If Bitcoin gets rejected from resistance:
-
The $86,000–$88,000 range is now a key battleground. Failure to clear this zone could result in a pullback toward $77,000 or even $74,000.
-
A break back below the 34 EMA on the weekly chart would weaken the bullish argument and reintroduce downside risk.
-
The MACD would likely fail to cross bullishly in that case, and RSI could drop back below support — both classic signs of continued distribution.
Turning Point in Sight
Bitcoin is sitting at a critical technical inflection point. The broader trend remains bullish, and the recent recovery is gaining strength, but confirmation above $86K and $91.5K is needed to fully reestablish bullish momentum. Until then, the market remains cautiously optimistic, with risk still present if resistance holds.
This is a textbook example of a market that may be bottoming, but needs follow-through to confirm. Watch the EMAs, potential MACD crossover, and horizontal levels in the coming days and weeks.