
Bitcoin is flashing multiple bearish signals on the weekly chart: momentum indicators have broken key support levels, the long-term rising channel has failed, and the moving averages are crossing bearishly for the first time this cycle.
While fear is extreme, often a contrarian signal, Bitcoin needs to reclaim major technical levels before confidence can return. The coming weeks could define whether this is a true bear market or the painful end of the four-year cycle, which forecasted a top around the end of 2025.
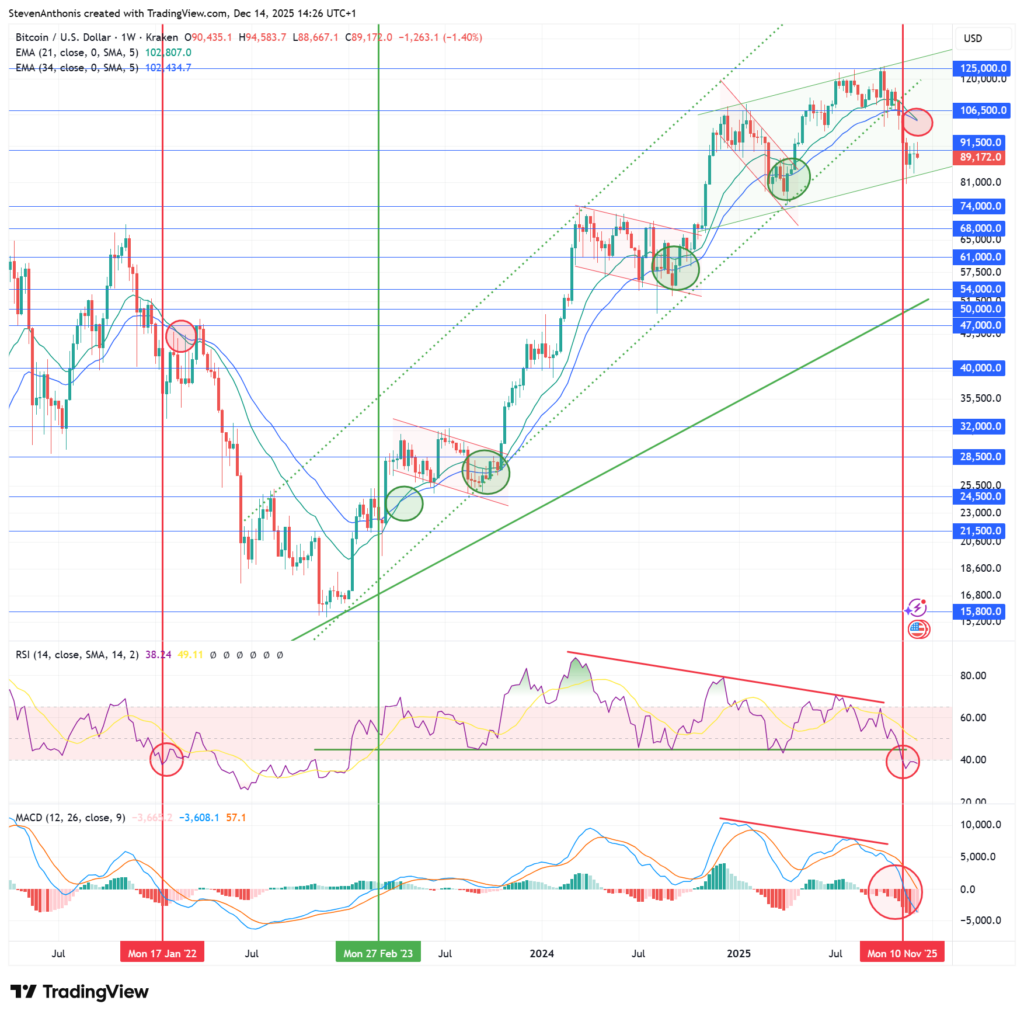
Weekly Bitcoin Technical Analysis
The weekly Bitcoin chart paints a noticeably weaker picture than during previous corrections within the bull market. Several technical elements now suggest that market conditions have fundamentally changed.
Key Technical Observations
1. Momentum Signals Point to a Bear Market
Bitcoin now shows classic bear market characteristics:
-
MACD has moved below zero (marked by the vertical red line), something we did not see during earlier bull-market pullbacks.
-
RSI has dropped below 40, indicating persistent downside momentum.
During the bull market, RSI consistently found support around 45, acting as a reliable floor. That support has now been decisively broken, which is a major warning sign.
2. Breakdown from the Rising Trend Channel
Bitcoin has clearly fallen out of the dotted rising trend channel that guided the entire bull run. Losing such a structural trend often signals the end of a market phase rather than a simple correction.
3. A New, Less Steep Channel, But Weak Price Action
Price appears to be forming a new, less steep channel, but this is not a sign of strength:
-
Bitcoin has already spent several weeks near the lower boundary of this new channel.
-
Strong markets usually rebound quickly from channel support, the current hesitation highlights underlying weakness.
4. Moving Averages Have Formed a Dead Cross
For the first time in this cycle, the shorter-term moving average is almost crossing below the longer-term one, forming a dead cross.
-
During previous bull-market corrections, these averages never crossed, even during sharp pullbacks.
-
This crossover confirms a structural shift in trend rather than a temporary dip.
5. Extreme Fear Still Dominates Sentiment
The Fear & Greed Index remains near extreme fear levels. Historically, such conditions often precede at least a short-term recovery. However, fear alone is not enough, price still needs to reclaim key technical levels.

Source: Alternative.me
Bullish Scenario: A Painful Reset Before New Highs
Despite the bearish technical structure, a bullish scenario cannot be ruled out.
For Bitcoin to regain strength:
-
Price must move back above the moving averages
-
A decisive reclaim of $106,500 is crucial
-
RSI should recover back above the 45–50 zone
-
MACD needs to flatten and eventually turn upward
If this happens, the current weakness could align with the the four-year cycle. Ironically, a recovery here might cause many market participants to question whether the four-year cycle is still valid. That doubt could fuel renewed buying pressure as investors rush to avoid missing another major move, potentially pushing Bitcoin to new all-time highs.
Bearish Scenario: Confirmation of a New Bear Market
If Bitcoin fails to reclaim the moving averages and remains below $106,500, the bearish case strengthens significantly.
In this scenario:
- RSI stays below 40–45
-
MACD continues to trend below zero
-
Price action remains weak and new lows are made
This would confirm that Bitcoin has entered a broader bear market, with rallies likely to be corrective rather than trend-reversing.
Conclusion
Bitcoin is at a decisive moment. The technical picture has clearly deteriorated compared to earlier corrections, with broken trend structure, weakening momentum, and bearish moving-average signals. At the same time, extreme fear suggests that the downside may be increasingly crowded.
Whether this is the beginning of a prolonged bear market or the final shakeout before another explosive rally will depend on one key question:
Can Bitcoin reclaim the moving averages and $106,500?
Until then, caution is warranted.