
Bitcoin is showing multiple bearish technical signals: a break below its long-term rising channel, falling under key moving averages, and the MACD dipping below zero for the first time since early 2022.
Extreme fear suggests a short-term bottom may form soon, but whether Bitcoin enters a deeper correction or stages a recovery rally will depend on how price reacts to the $106,500 level.
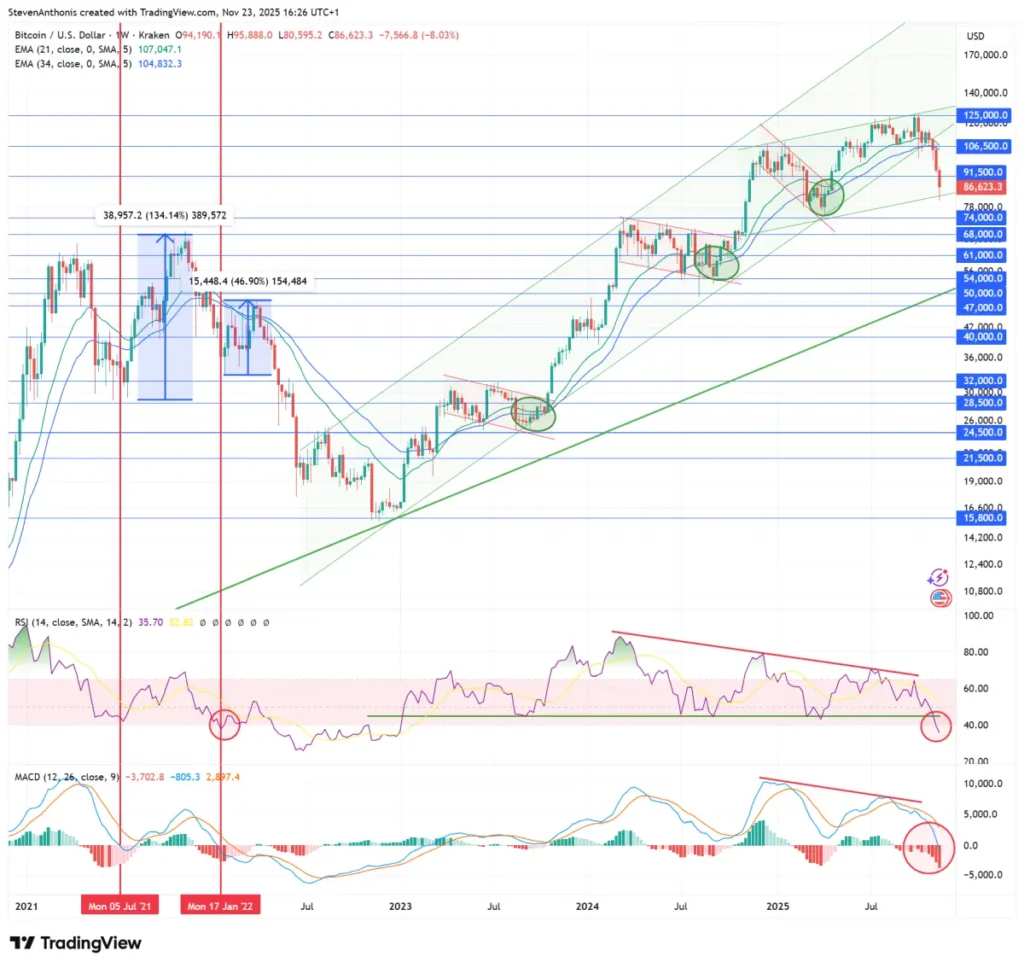
Bitcoin Technical Analysis: Multiple Negative Signals Emerge on the Weekly Chart
The weekly Bitcoin chart shows a clear shift in momentum. After months of steady upward movement inside a strong rising channel, Bitcoin is now flashing several technical warning signs suggesting that the broader trend may be weakening.
Below is a detailed breakdown of the major signals, followed by bullish and bearish scenarios.
Key Technical Observations
1. Numerous Negative Technical Signals
Several indicators that previously supported the bullish trend are now turning negative. Momentum is clearly deteriorating, and the structure of the chart has weakened significantly.
2. Bearish Divergences Were Already Forming
Both RSI and MACD had been forming lower highs while price made higher highs, creating clear bearish divergences. These divergences often precede larger corrections, and now they appear to be playing out.
3. Bitcoin Has Broken Below the Long-Term Rising Channel
The multi-year upward channel has been decisively lost. Once a major trendline breaks, it often signals a transition to a slower uptrend, or the beginning of a more significant correction.
There is the possibility, however, that Bitcoin is entering a new, less steep rising channel, which would imply a slower bull trend.
4. Price Has Fallen Below the 21 and 34 EMAs
For the first time in a long period, weekly candles have significantly closed below both moving averages. In previous corrections, price briefly dipped below but quickly recovered, this time the breakdown looks more sustained.
5. RSI Breaks Below the 45 Zone
The RSI level around 45 acted as strong support multiple times during this bull market.
Now, RSI is falling below that level, a bearish development suggesting momentum has shifted decisively downward.
6. MACD Turning Below Zero for the First Time Since January 2022
This is one of the strongest signals on the chart. The weekly MACD crossing below zero often marks significant trend shifts.
-
January 2022 analogy:
MACD fell below zero, Bitcoin bounced +46.9%, but then the downtrend continued. -
July 2021 analogy:
MACD briefly went negative, Bitcoin dipped under $30,000, then rallied to new all-time highs at $68,000.
Either scenario is possible, depending on how Bitcoin behaves around major support.
7. Fear & Greed Index at 10
Extreme fear historically aligns with short-term bottoms. Even in bear markets, extreme fear often produces temporary relief rallies.
Bullish Scenario
Despite the overwhelming bearish momentum, there is a viable bullish case:
What the bulls want to see:
-
A strong rebound from the current low extreme fear levels
-
Price climbing back above $91,500, then $106,500
-
MACD stabilizing and curling upward
-
RSI reclaiming the 45–50 zone
-
Re-entering the new or old rising channel
If this happens:
Bitcoin could follow the July 2021 scenario:
A sharp drop, a quick MACD dip below zero, followed by a strong recovery rally.
If Bitcoin reclaims $106,500, a retest of $125,000 becomes realistic. Above $125,000, the bull trend resumes with potential targets toward the top of the broader rising channel.
Bearish Scenario
The bearish case appears stronger at the moment:
Warning signs:
-
MACD crossing below zero
-
RSI breaking long-term support
-
Price below key EMAs
-
Major channel break
-
Bearish divergences confirmed
If Bitcoin cannot reclaim $91,500–$106,500:
Price could continue declining toward deeper support zones:
-
$74,000
-
$68,000
- $61,000
This scenario resembles January 2022, where Bitcoin made a temporary bounce before rolling over into a longer downtrend.
If momentum keeps weakening, a larger correction is possible before a new bullish structure forms.
Conclusion
Bitcoin is entering a critical phase. Momentum indicators, trend structure, and divergences point to meaningful weakness, but extreme fear suggests a short-term bottom may be forming.
The coming weeks will revolve around one key question:
Can Bitcoin reclaim $106,500?
-
Above it: Bullish momentum returns, opening the door for another run toward the highs.
-
Below it: The downtrend may continue, matching the January 2022 playbook.
For now, caution is warranted, but so is readiness for a sharp rebound.