
After a brutal 52% correction from its $125,000 peak, Bitcoin is showing its first signs of life. A bounce from the 200 EMA and a breakout from the short-term downtrend hint at a possible shift, but heavy resistance still looms overhead. Is this the start of a recovery, or just a pause before further downside?
Bitcoin topped out around $125,000 in October 2025, marking the peak of a powerful bull run. Since then, price has retraced sharply to around $60,000, a 52% correction. That’s well within historical norms for Bitcoin, but still significant enough to shift market structure.
Bear Market Confirmation
Let’s be clear: this has been a bear market phase.
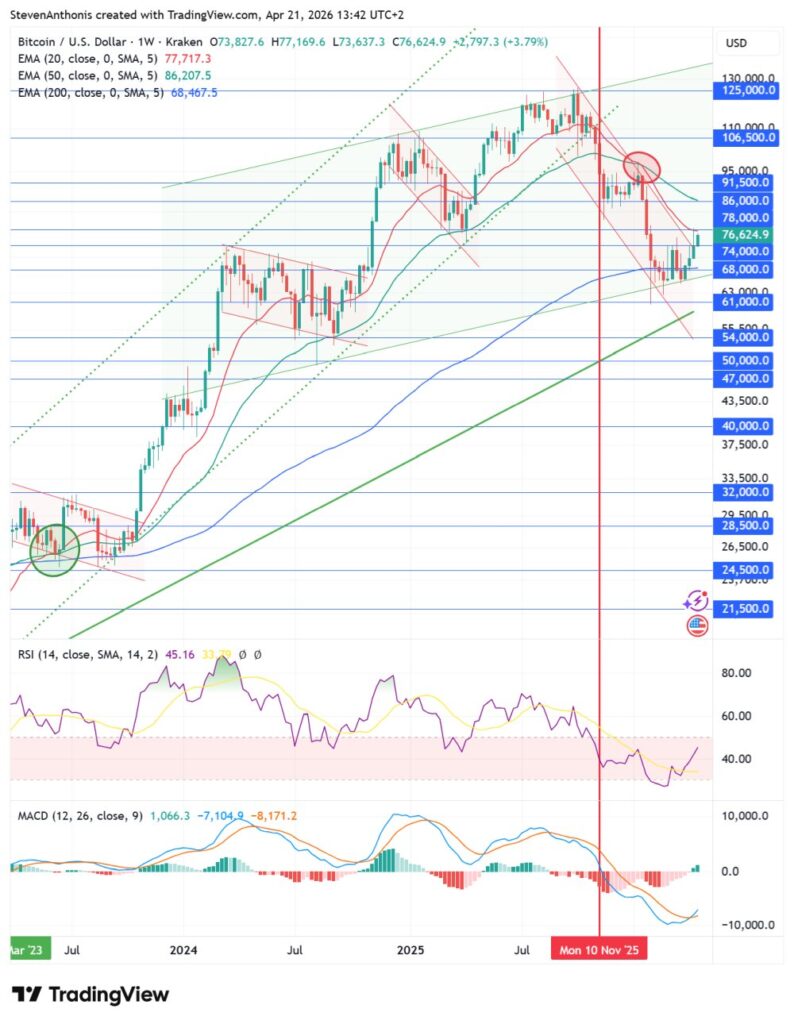
- The MACD is below zero, confirming negative momentum on the higher timeframe
- Price broke down from its prior uptrend in the dotted green channel and formed a clear lower high structure
- The rejection near the $95K region marked a trend transition
First Signs of Strength
However, the chart is no longer purely bearish.
Several important developments stand out:
- 200 EMA support held
Bitcoin has tested the 200 EMA multiple times and bounced around that level. This is a key long-term support level. - Breakout from short-term downtrend
Price has now broken above the red descending channel, signaling a potential shift in short-term momentum. - Higher low formation?
The recent bounce suggests buyers are stepping in earlier, possibly leading to a higher low during the next correction. - MACD bullish crossover
While still negative, the MACD histogram is improving and bearish momentum is fading. The indicator even made a bullish crossover.
Key Resistance Levels Ahead
Despite this early strength, Bitcoin faces heavy resistance overhead:
- $78,000: First key horizontal resistance
- $86,000: Strong resistance + previous support zone
- 20 EMA & 50 EMA: Dynamic resistance, both currently above price
These levels will act as tests. Reclaiming them would significantly strengthen the bullish case.
The Bigger Picture: still an uptrend?
Zooming out reveals something important:
- Bitcoin is still trading within a long-term upward green channel
- The recent correction perfectly bounced off the lower boundary of that channel
This suggests the broader trend may still be intact, the trend is simply less steep.
Bullish Scenario
For bulls to take control, Bitcoin needs to:
- Hold above the 200 EMA
- Continue forming higher lows
- Break above $78K and $86K
- Reclaim the 20 and 50 EMA
If that happens:
- Momentum could accelerate quickly
- A move back toward $100K+ becomes realistic
- The correction may be reclassified as a mid-cycle pullback
Bearish Scenario
The bear case remains a valid scenario.
Warning signs would include:
- Rejection at $78K–$86K resistance
- Failure to reclaim moving averages
- A breakdown below the 200 EMA
If that happens:
- Bitcoin could revisit $60K support
- A breakdown there opens the door to $50K–$54K
- The structure shifts toward a prolonged bear market
Final Thoughts
The market has moved from clear bearish momentum to early signs of recovery, but it hasn’t flipped bullish yet. This is the kind of environment where both scenarios are valid, and the next few weekly closes will be critical.