
Bitcoin has just broken out to new all-time highs after weeks of consolidation around $106,500. With RSI and MACD supporting the move and a long-term bullish trend intact, the path to the top of the rising channel around $175,000 is now open.
Chart Analysis – Weekly Timeframe
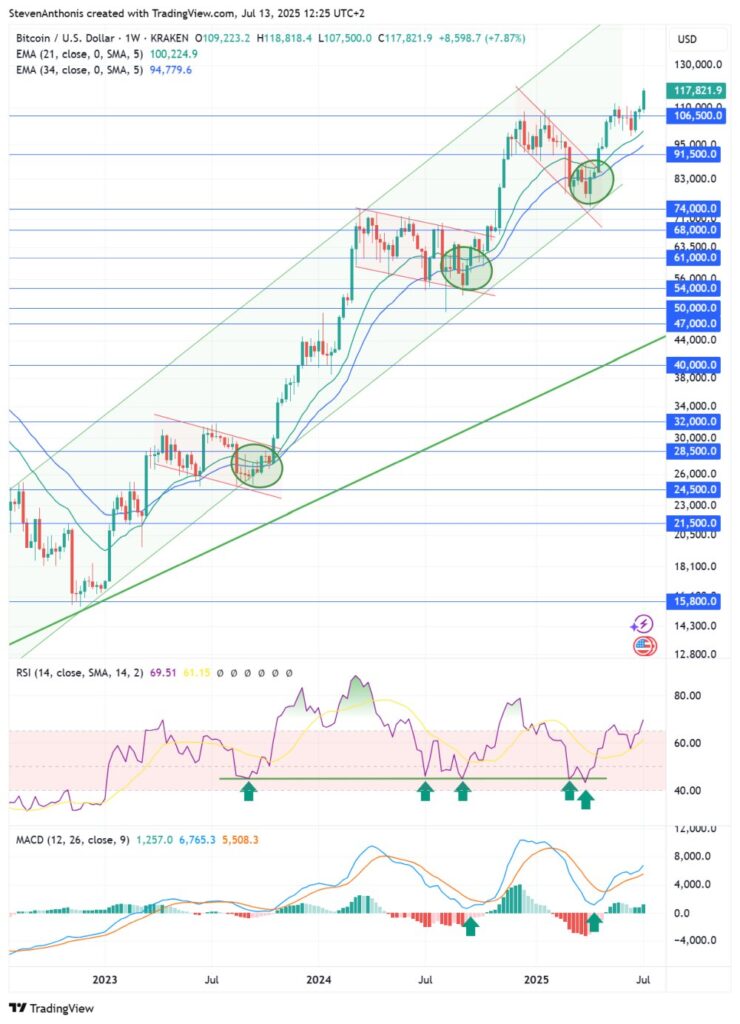
Bitcoin continues to follow a well-defined long-term rising channel, which has guided price action since early 2023. After reaching a local top near $106,500 at the end of 2024, BTC entered a corrective phase that looked very similar to the two prior corrections marked by green circles on the chart:
-
In each case, price briefly dipped below the 21 and 34-week EMAs, but crucially, the moving averages did not form a bearish cross (dead cross).
-
The RSI consistently bounced around the 45 level, providing a reliable signal for trend continuation.
-
The MACD remained above the zero line and has now turned back up again, printing a bullish crossover.
These technical signs have acted as bullish confirmation patterns in each of the three major corrections since 2023.
Recent Price Action: Retest and Breakout
After bouncing around the $78,000 level, Bitcoin reclaimed both the 21 EMA and 34 EMA and began grinding higher. For several weeks, the zone around the $106,500 resistance capped the rally, until the current candle decisively broke above it.
This breakout to new all-time highs around $118,000 suggests renewed bullish momentum. Historically, Bitcoin has shown strong impulsive moves after breaking out of extended consolidation patterns.
Bullish Scenario
If the breakout holds:
-
Price target: The top of the rising green channel currently sits around $175,000, offering substantial upside potential.
-
Support: The previous high at $106,500 becomes new support, followed by the 21 and 34 EMAs (~$100,000 and ~$95,000 respectively).
-
Momentum: RSI at ~70 shows strength but not extreme overbought levels yet. MACD is gaining upward momentum with a bullish cross above zero, which is a historically powerful signal.
Key confirmation would be follow-through in volume and trend continuation.
Bearish Scenario
If the breakout fails:
-
The current move could be a bull trap, with price unable to hold above $106,500.
-
In that case, a retracement toward the moving averages (~$100,000–$95,000) is possible.
-
A break below $91,500 would be a serious warning sign, suggesting a deeper correction — possibly back to the mid-$80,000 range or even $74,000.
-
Divergences (e.g. higher highs in price without new highs in RSI or MACD) would also raise red flags.
So far, however, no such divergence is visible, and the trend remains clearly bullish.
Other Noteworthy Observations
-
The structure of each correction is similar: descending channel breakouts, reclaiming the EMAs, RSI bounces at the same level, and MACD flips bullish.
-
This rhythmic pattern adds to the credibility of the current breakout.
-
Bitcoin is in uncharted territory, so round-number psychological levels like $125,000, $150,000, and $175,000 will become increasingly relevant as resistance.
Conclusion
Bitcoin has reclaimed its momentum after a textbook correction and consolidation phase. With a decisive breakout above $106,500 and a bullish setup on all major indicators, the long-term trend remains intact. The next stop? Potentially $175,000, the top of the current rising channel, unless sellers step in and invalidate the breakout.