
Bitcoin is once again pulling back within its long-term rising channel, mirroring previous mid-cycle corrections that ultimately led to new highs. The RSI is approaching its key 45 support level, and the MACD is cooling off but still above zero.
Will this be another textbook dip before continuation, or the first real warning sign of a trend reversal?
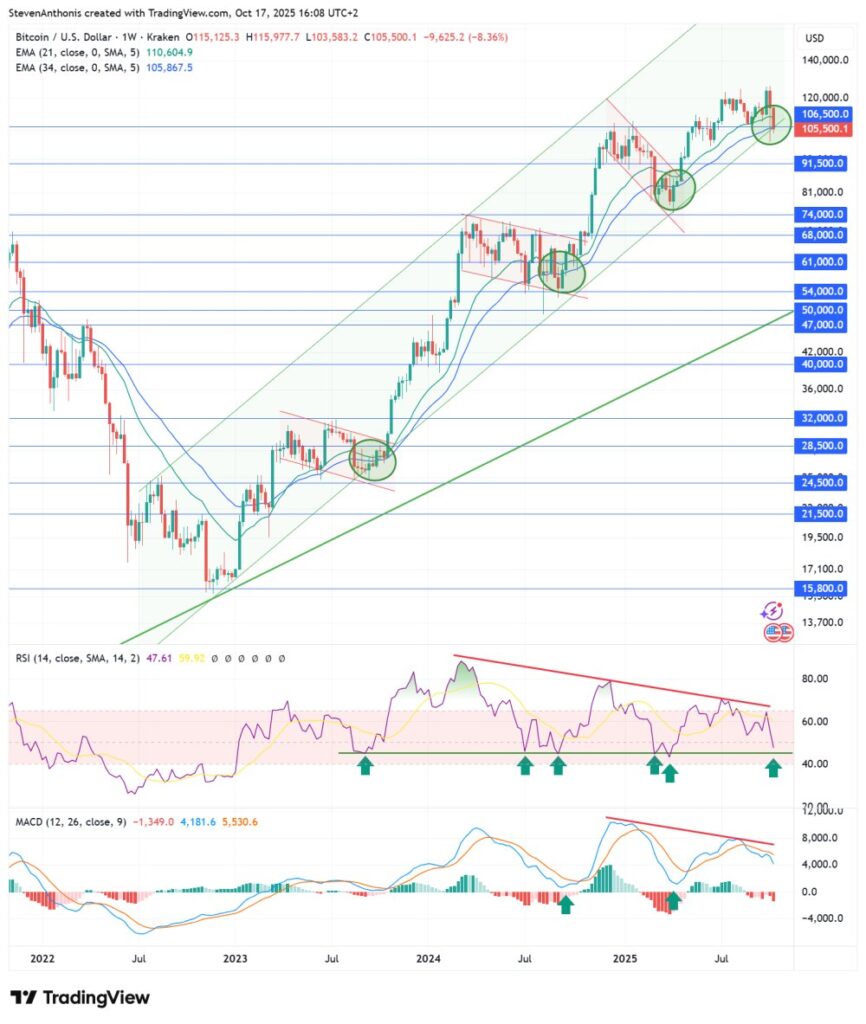
Technical Overview – Weekly Chart
Bitcoin’s long-term structure remains intact. The price continues to trade inside a broad green rising channel that has defined the entire bull cycle since late 2022.
We now see the same corrective behavior that occurred in the three previous green-circled areas on the chart:
-
In each previous instance, Bitcoin fell below the 21- and 34-week EMAs, but those averages did not cross for a bearish signal (dead cross).
-
Each correction found support just below the EMA zone, followed by a renewed rally that took price to new highs.
-
The RSI consistently bounced around the 45 level, marking the turning point of each correction.
Currently, BTC is repeating this same pattern: it is dropping below the moving averages but remains above key horizontal and trendline supports.
Momentum Indicators – RSI & MACD
-
RSI (47.6): The Relative Strength Index is testing the same area (~45) that served as strong support in past corrections. This level has been a reliable signal for bull market pullbacks. A bounce here would suggest renewed strength, while a breakdown would be an early warning sign.
-
MACD: While a bearish centerline crossover is possible, the MACD line remains above zero, meaning long-term momentum is still positive.
Interestingly, both RSI and MACD show a mild bearish divergence compared to previous highs, a potential early sign of weakening momentum that traders should monitor.
Bullish Scenario
If history repeats itself, this pullback could again serve as a healthy reset in an ongoing bull market:
-
The rising channel remains unbroken.
-
RSI finds support near 45–50, and MACD stabilizes above zero.
-
Price quickly reclaims the 21-week EMA (~$110,600) and turns it back into support.
In this case, the next upward leg could target:
-
$120,000, the recent high
-
Followed by $135,000–$140,000 and more uncharted territory.
This would continue the pattern of “higher highs and higher lows” that has defined the cycle.
Bearish Scenario
If Bitcoin fails to hold support around the $105,000 area:
-
A break below the EMAs could invite deeper selling pressure, targeting $91,500, the next horizontal support.
-
A weekly close below $91,500 would likely confirm a larger correction phase, with potential downside toward $74,000.
-
The RSI breaking below 45 and MACD turning negative would confirm a shift in medium-term momentum.
Such a move wouldn’t necessarily end the bull market, but it would indicate a more prolonged consolidation phase, similar to mid-2021 or mid-2023.
Key Takeaways
-
Bitcoin is retesting its EMA zone, as seen in all previous corrections within this uptrend.
-
RSI at 45 remains the line between a continuation of the bull trend and a potential deeper correction.
-
The structure remains bullish until proven otherwise, as long as price stays within the rising channel and above $91,500.
Conclusion
Bitcoin’s current pullback fits perfectly within the context of previous mid-cycle corrections. The trend remains bullish on a macro level, but momentum has weakened, and bulls need to defend key support zones around $105,000–$106,500.
If RSI holds the 45 level and the EMAs are reclaimed, the next rally could target new all-time highs toward $135,000+. If not, brace for a larger correction phase that could test the lower bounds of this multi-year trend channel.