
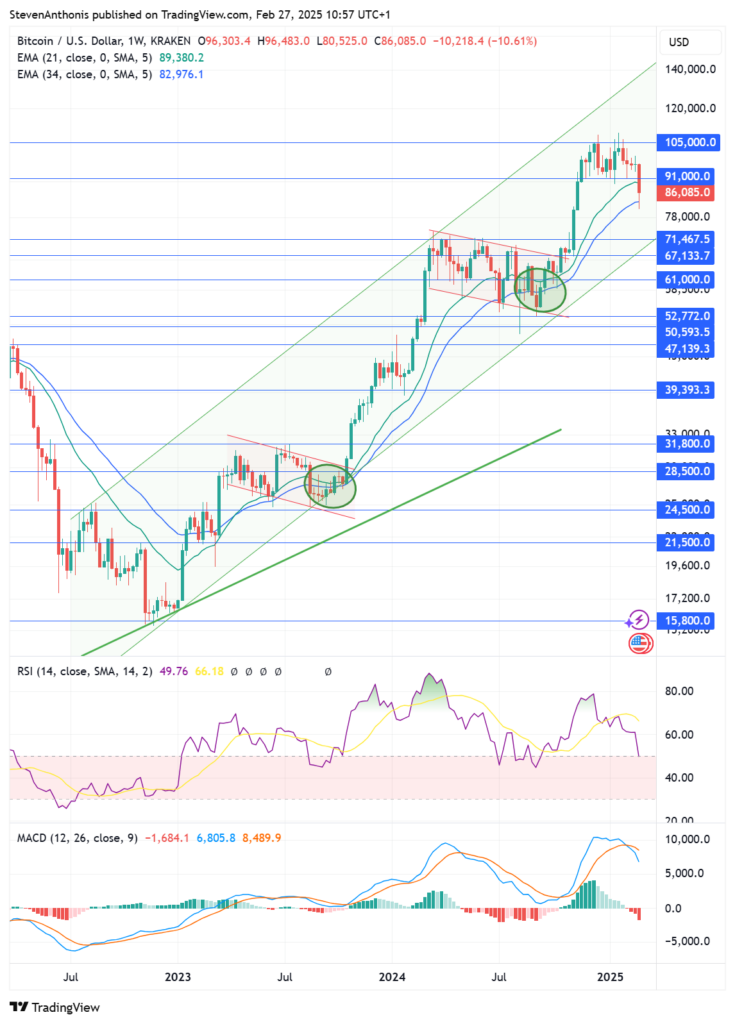
This weekly BTC/USD chart is well-structured, with a clear uptrend, key support/resistance levels, and a recent pullback. Let’s analyze the situation and explore specific trade setups.
1. Trend & Price Action
- Bitcoin remains in a strong uptrend, moving within an ascending channel.
- The price recently pulled back from ~105,000 and is now testing key support around 86,000 – 91,000.
- The 21 EMA (89,382) and 34 EMA (82,977) are acting as dynamic support levels.
2. RSI Analysis (Relative Strength Index)
- Current RSI: 49.79 → Neutral zone, showing a loss of bullish momentum.
- RSI failed to stay above 70, indicating a cooling-off period after an overbought condition.
- If RSI drops below 45, further downside could be expected.
3. MACD Analysis (Moving Average Convergence Divergence)
- Bearish crossover detected: The MACD line crossed below the signal line, signaling weakening momentum.
- The histogram shows increasing red bars, confirming short-term bearish pressure.
- If MACD stays negative, BTC could correct deeper toward lower support levels.
4. Key Support & Resistance Levels
✅ Resistance Levels:
- 91,000 → Key level to reclaim for bullish continuation.
- 105,000 → Major resistance (previous high).
Support Levels:
- 86,000 → Testing this level now. A breakdown could accelerate selling.
- 71,400 – 67,100 → Strong support zone from previous price action.
- 52,700 – 50,500 → Critical long-term support if the correction deepens.
5. Trade Setups
✅ Bullish Trade Setup (Breakout Play)
- Entry: Buy a weekly close above 91,000 (reclaiming lost support).
- Target 1: 105,000
- Target 2: 120,000+ (channel resistance)
- Stop-loss: Below 86,000
Confirmation: Look for RSI to hold above 50 and MACD to slow down bearish momentum.
✅ Bullish Trade Setup (Dip Buy Entry)
- Entry: Buy at 71,400 – 67,100 support zone if BTC drops further.
- Target 1: 86,000
- Target 2: 91,000
- Stop-loss: Below 65,000
Confirmation: Look for a bullish reversal candlestick (e.g., hammer or engulfing) and RSI bouncing off oversold levels.
Bearish Trade Setup (Short Opportunity)
- Entry: Sell if BTC rejects 91,000 or breaks below 86,000.
- Target 1: 71,400
- Target 2: 52,700
- Stop-loss: Above 92,000
Confirmation: MACD histogram turning more negative and RSI dropping below 45.
6. Conclusion & Bias
- Short-term bearish, but long-term bullish structure remains intact.
- If BTC holds 86,000-91,000, we could see a bounce toward 105,000.
- If BTC loses 86,000, a deeper pullback to 71,000 – 67,000 is possible.
Best trade: Buy a confirmed bounce from support or reclaim of 91,000!